Collecting eye tracking data
The EyeTracker element is supported by a limited set of browsers. For best results, your participants should use Chrome desktop or Firefox desktop. Even so, calibrating is likely to fail for some of your participants for a number of reasons (ambient light, background shapes, facial characteristics, webcam position, etc.). Because chances are that several people will experience issues with eye-tracking, we advise awareness when recruiting participants. If you recruit paid labor, set a time limit and be willing to pay participants who could not complete your experiment.
In this guide, we will design a simple eye-tracking experiment splitting the page in four quarters. Our ultimate goal will be to plot a graph reporting the timecourse of gazes to each quarter over time. If all goes well, looks should converge toward the quarter that was clicked at the end of the trial.
Note that in order to collect eye-tracking data, you need to have access to a server where you can upload and execute PHP scripts. Platforms like DreamHost offer this service with minimal setup, and server providers like Linode require more advanced setup. Resource-sharing services like Dropbox or Google Drive do NOT support PHP scripts.
Note: PHP extension mbstring must be enabled on the server for the PHP script to run successfully.
The Experiment
Create a new experiment using the EyeTracking starter experiment. This will import the necessary resources:
- A table file named clefts.csv that describes the different conditions of our design
- An aesthetics file named PennController.css that will take care of adding a frame around the element being looked at
- A main script file named main.js that defines the structure of our experiment and of our trials
- PennController.js
We will only take a look at main.js and simply skip over clefts.csv, as we will end up only using half of it anyway. The experiment is a simplified and decontextualized version of an experiment that was run with an EyeLink eye-tracker machine in Florian Schwarz’s lab.
On each trial, independent of the other trials, the participant is presented with four characters, each associated with a card showing one of the four suits hearts, diamonds, clubs or spades. The character are supposed to join the “house” corresponding to the suit of the card that they were dealt. The participant listens to a recording of the “role master” saying something about a named character, and their task is to identify as quickly as they can who is the named character using all the information available.
Structure of the main script
This section gives an overview of the file main.js.
The three PreloadZip lines import the images and the audio files that we will use from a distant server. See the guide Zipped Resources to learn more about it.
The next EyeTrackerURL line specifies where to find the PHP script that will receive the eye-tracking data, and that will also take care of decoding the lines and serving them as CSV files at the analyses step. You should set up your own PHP script when running your own experiments, as this is where your participants’ data will be stored. We will come back to the PHP setup procedure below, but for the purpose of this experiment we can keep the provided URL.
You may have noticed that this experiment does not contain a Sequence command: all the trials will therefore be executed in the top-down order in which they are defined, and accordingly no label is explicitly assigned to any trial. A real experiment would of course do things differently and need to assign labels so as to randomize the presentation of the different trials.
Welcome trial
Most of it is pretty straightforward. Two things to note:
-
The
newEyeTracker("tracker").test.ready()test command inside the wait command in the button accomplishes two things: (1) it triggers a webcam-access request, and (2) it makes sure that the script’s execution is only released by a click on the button after access has been granted. This is a necessary step, you should always have this test command early in your experiment. -
After we go fullscreen (which we do after the request, as the request exists fullscreen mode in some browsers) we calibrate the tracker with a label of 60% (
getEyeTracker("tracker").calibrate(60)). Because this is the first calibrate command in the experiment, this will launch a sequence of clicks on nine buttons aligned on the edges and corners of the page (=screen now that we are fullscreen) and one last click on a central button. The participant must fixate the button for 3 seconds to ensure that at least 60% of the estimated looks fall on the button. None of this is explicitly mentioned in this experiment, but you should add some instructions before that in your own experiment.
Once the welcome trial is over, the eyetracker is calibrated, and subsequent calibrate commands will immediately jump to the 3-second central button and check that calibration is still over whatever value is passed to the calibrate command. If calibration has fallen under the passed threshold, the 9-button sequence starts over.
Note that we insert a CheckPreloaded trial after calibration to give the resources time to preload the background while setting up the tracker.
Experimental trials
Note that the first thing we do in the experimental trials is to use calibrate again, to make sure that the tracker’s accuracy has not fallen under 60%. If it has, the command automatically invites the participant to follow the calibration procedure again.
Most of the rest of the trial is pretty straightforward. Some highlights:
-
We create big Canvas elements: each is sized to 40% of the page’s width/height. Then we add smaller images inside each of them. This way, when the participant looks at the images, they are also necessarily looking at the containing Canvas element. By then tracking the Canvas elements rather than the images themselves, we are more likely to capture look estimates that are slighlty off the actual target.
-
This design does not shuffle the position of the elements, but keep in mind that we track the Canvas elements, which are therefore the elements you would want to shuffle. In order to keep track of which one ended on which quarter of the page, you would then need set (and log) Var elements after testing their position.
-
We start the tracker only after revealing the suits, because we are not interested in what happens before that. At this point however, participants are most likely no longer looking at the center of the screen. A better design solution would be to print a button at the center of the screen and reveal the suits only after the participant has clicked the button.
-
We call log on the EyeTracker element: if we failed to do, we would effectively never collect the eye-tracking data.
-
We also call log on the Selector element, because we will eventually compare the looks against which Canvas was clicked.
-
We stop collecting eye-data as soon as a Canvas is clicked in an effort to minimize the size of the data collected.
Final trials
Nothing special here: we SendResults after the last experimental trial—the eye-tracking data have been independently sent to our PHP script after each trial. After sending the data, we exit fullscreen mode and show a final message on the page. We use the dummy-element-wait method to stay on the page forever (that is, until the participant decides to close the tab).
PHP Script
Create a new PHP file on your servers with the following content:
<?php
  header("Access-Control-Allow-Methods: GET, PUT, OPTIONS");
  header("Access-Control-Allow-Headers: authorization, x-requested-with, content-type, access-control-allow-methods");

  function subarray(){
        $return = [];
        if (func_num_args()>0){
            $ar = func_get_arg(0);
            if (gettype($ar) == "array" && func_num_args()>1){
                for ($i = 1; $i < func_num_args(); $i++){
                    $key = func_get_arg($i);
                    if (array_key_exists($key, $ar)){
                        $return[$i] = $ar[$key];
                    }
                }
            }
        }
        return $return;
  }

  function lzw_decode($s) {
    mb_internal_encoding('UTF-8');

    $dict = array();
    $currChar = mb_substr($s, 0, 1);
    $oldPhrase = $currChar;
    $out = array($currChar);
    $code = 256;
    $phrase = '';

    for ($i=1; $i < mb_strlen($s); $i++) {
        $currCode = implode(unpack('N*', str_pad(iconv('UTF-8', 'UTF-16BE', mb_substr($s, $i, 1)), 4, "\x00", STR_PAD_LEFT)));
        if($currCode < 256) {
            $phrase = mb_substr($s, $i, 1);
        } else {
           $phrase = isset($dict[$currCode]) ? $dict[$currCode] : ($oldPhrase.$currChar);
        }
        $out[] = $phrase;
        $currChar = mb_substr($phrase, 0, 1);
        $dict[$code] = $oldPhrase.$currChar;
        $code++;
        $oldPhrase = $phrase;
    }
    // var_dump($dict);
    return(implode($out));
  }

  function generateTable($filename){

    $dictionary = array();
    $file = fopen($filename,"r");
    while(!feof($file)){
        $line = rtrim(fgets($file), "\n\r");
        $cells = explode(",",$line);
        $trial = $cells[0];
        $param = $cells[1];
        $value = $cells[2];
        if (!array_key_exists($param,$dictionary)){
            $dictionary[$param] = array();
        }
        $dictionary[$param][$trial] = explode('.', lzw_decode( $value ) );
    }


    $parameters = array_keys($dictionary);
    $stringTable = 'trial';
    for ($p = 0; $p < count($parameters); $p++){
        $stringTable = $stringTable.','.$parameters[$p];
    }
    $trials = array_keys($dictionary['times']);
    for ($t = 0; $t < count($trials); $t++){
        $trial = $trials[$t];
        $timelines = $dictionary['times'][$trial];
        $time = 0;
        for ($l = 0; $l < count($timelines); $l++){
          $stringTable = $stringTable."\n".$trial;
          for ($p = 0; $p < count($parameters); $p++){
            $param = $parameters[$p];
            $value = $dictionary[$param][$trial][$l];
            if ($param=='times'){
                $time = $time + intval($value);
                $value = $time;
            }
            $stringTable = $stringTable.','.$value;
          }
        }
    }
    return($stringTable);
  }

  if ($_POST['json']) {
        $json = json_decode($_POST['json'], true);
        $directory = mb_ereg_replace("([^\w\d])", '', $json['experiment']);
        $directory = mb_ereg_replace("([\.]{2,})", '', $directory);
        if (is_dir($directory) === false) {
            mkdir($directory);
        }
        $data = fopen($directory.'/'.$json['id'], "a") or die("Unable to open file");
        flock($data, LOCK_EX);
        $line = subarray($json, 'pcnumber', 'parameter', 'value');
        fwrite($data, implode(',',$line));
        fwrite($data, "\n");
        flock($data, LOCK_UN);
        fclose($data);
  }
  else if (isset($_GET['experiment'])) {
      header("Content-Type: text/plain");
      print( generateTable($_GET['experiment']) );
  }
  else{
?>

<html>
<head>
    <title>Get EyeTracker data</title>
</head>
<body>
    <div>
        <form method='get' action="">
            Experiment's URL: <input type="text" name="experiment"><br>
            <input type="submit" value="Submit">
        </form>
    </div>
</body>
</html>

<?php
}
?>
Make sure that the file has permission to create new folders in its directory, as it will create one folder per experiment.
This script will take care of receiving and storing encoding data lines in subfolders and one file per participant. It will also output back files where the lines have been decoded. You can directly visit it through your browser and type in the field that you see the “URL” key that was reported in your results file (something like httpsdomainofmyexperiment/pathtomyexperiment/vEry-l0ng-uniQu3-1dentif1er). Alternatively, you can directly append key at the end of the PHP script’s url (replacing key with the value from your results file) to get the output file — this is the method we will use in our analyses.
Analyses
Do a few test runs of your experiment to generate some results, or download the results file I generated (= two test runs).
We will use R to analyze the results file. First we will copy the read.pcibex function from this page of the tutorial. Then we will require the packages ggplot2, dplyr, and tidyr:
require("ggplot2")
require("dplyr")
require("tidyr")
Then we will tell our script where the PHP file is, and what time-window to use to bin the eye-tracking data points. In this example, we will compute the mean looks to each element over time-windows of 100ms:
# The URL where the data is stored; note the ?experiment= at the end
ETURL = "http://files.lab.florianschwarz.net/ibexfiles/RecordingsFromIbex/EyeTracker.php?experiment="
# Time-window to bin the looks
BIN_DURATION = 100
Then we simply import our results file, and rename the Reception Time column “Participant” as this is what we’ll use to identify sessions (if, like me, you took the same experiment twice, all the lines have the same MD5 hash).
# We'll use Reception time to identify individual sessions
results <- read.pcibex("results.csv")
names(results)[1] <- 'Participant'
Now we’ll import the data from our PHP script. To do so, we’ll first subset our data frame to the EyeTracker rows that report the URL keys. Since there were 24 trials, the same key is repeated 24 times for each session, so we’ll also subset to the rows corresponding to the first item only. Then we simply read the CSV files that are output by our PHP script for each URL key, and append the output to our EyeTracker data frame:
# Read ET data file for each session and append output to ETdata
ETdata = data.frame()
filesDF <- subset(results, Parameter=="Filename"&Type=="Item-1")
apply(filesDF, 1, function(row) {
  data <- read.csv(paste(ETURL,as.character(row[['Value']]),sep=''))
  data$Participant <- row[['Participant']]
  ETdata <<- rbind(ETdata,data)
})
At this point, the ETdata data frame contains individual data points, collected every tens of milliseconds (depending on the time resolution of the EyeTracker element upon runtime). Let us bin those in intervals of 100ms:
# Bin the data
ETdata$bin <- BIN_DURATION*floor(ETdata$times/BIN_DURATION)
ETdata <- ETdata %>% group_by(Participant,trial,bin) %>% mutate(
    top_female=mean(X_topFemaleIA),
    bottom_female=mean(X_bottomFemaleIA),
    top_male=mean(X_topMaleIA),
    bottom_male=mean(X_bottomMaleIA),
  )
Now the our data frame has four additional columns reporting the proportion of looks to each quarter of the page every 100ms.
We also want to know which quarter the participant ended up selecting on each of the trial. That piece of information is stored in the results data frame, and we will now import it into the ETdata data frame (note that Item.number from results corresponds to trial from ETdata):
# Add final choice to ETdata
answers <- results[results$Parameter=="Selection", c("Participant","Item.number","Value")]
names(answers) <- c("Participant", "trial", "Selection")
ETdata <- merge(ETdata,answers,by=c("Participant","trial"))
Before plotting a graph, we want to proceed to a few transformations of our data: right now each bin is repeated multiple times in ETdata, because each row is an individual data point, and each quarter is coded as a column. It is easier with ggplot to have only one row per bin per quarter instead. Here is how we can do this:
# Some transformations before plotting
#  - only keep first row for each bin per participant+trial
ETdata_toplot <- ETdata %>% group_by(Participant,trial,bin) %>% filter(row_number()==1)
#  - from wide to long (see http://www.cookbook-r.com/Manipulating_data/Converting_data_between_wide_and_long_format/)
ETdata_toplot <- gather(ETdata_toplot, focus, gaze, top_female:bottom_male)
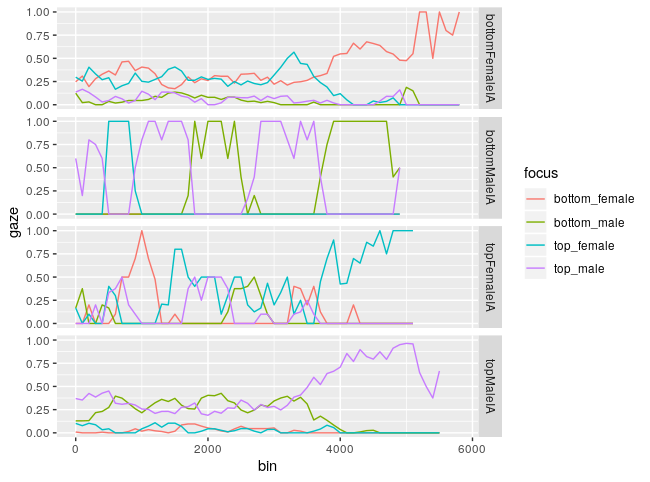
We now have a data frame that is ready for plotting. We’ll look at the evolution of the mean proportion of gazes over time, depending on which quarter was selected:
# Plot the results
ggplot(ETdata_toplot, aes(x=bin,y=gaze,color=focus)) +
  geom_line(stat="summary",fun.y="mean") +
  facet_grid(Selection~.)
Note that the less often a quarter was selected, the fewer data points we got, and so the less smooth our lines are.
This is reassuring: the looks converge toward the quarter that ended up being clicked:
Full R Script
# Imports
read.pcibex <- function(filepath, auto.colnames=TRUE, fun.col=function(col,cols){cols[cols==col]<-paste(col,"Ibex",sep=".");return(cols)}) {
  n.cols <- max(count.fields(filepath,sep=",",quote=NULL),na.rm=TRUE)
  if (auto.colnames){
    cols <- c()
    con <- file(filepath, "r")
    while ( TRUE ) {
      line <- readLines(con, n = 1, warn=FALSE)
      if ( length(line) == 0) {
        break
      }
      m <- regmatches(line,regexec("^# (\\d+)\\. (.+)\\.$",line))[[1]]
      if (length(m) == 3) {
        index <- as.numeric(m[2])
        value <- m[3]
        if (is.function(fun.col)){
          cols <- fun.col(value,cols)
        }
        cols[index] <- value
        if (index == n.cols){
          break
        }
      }
    }
    close(con)
    return(read.csv(filepath, comment.char="#", header=FALSE, col.names=cols))
  }
  else{
    return(read.csv(filepath, comment.char="#", header=FALSE, col.names=seq(1:n.cols)))
  }
}
require("dplyr")
require("ggplot2")
require("tidyr")

# The URL where the data is stored
ETURL = "http://files.lab.florianschwarz.net/ibexfiles/RecordingsFromIbex/EyeTracker.php?experiment="
# Time-window to bin the looks
BIN_DURATION = 100

# We'll use Reception time to identify individual sessions
results <- read.pcibex("results.csv")
names(results)[1] <- 'Participant'

# Read ET data file for each session and append output to ETdata
ETdata = data.frame()
filesDF <- subset(results, Parameter=="Filename"&Type=="Item-1")
apply(filesDF, 1, function(row) {
  data <- read.csv(paste(ETURL,as.character(row[['Value']]),sep=''))
  data$Participant <- row[['Participant']]
  ETdata <<- rbind(ETdata,data)
})

# Bin the data
ETdata$bin <- BIN_DURATION*floor(ETdata$times/BIN_DURATION)
ETdata <- ETdata %>% group_by(Participant,trial,bin) %>% mutate(
    top_female=mean(X_topFemaleIA),
    bottom_female=mean(X_bottomFemaleIA),
    top_male=mean(X_topMaleIA),
    bottom_male=mean(X_bottomMaleIA),
  )

# Add final choice to ETdata
answers <- results[results$Parameter=="Selection", c("Participant","Item.number","Value")]
names(answers) <- c("Participant", "trial", "Selection")
ETdata <- merge(ETdata,answers,by=c("Participant","trial"))

# Some transformations before plotting
#  - only keep first row for each bin per participant+trial
ETdata_toplot <- ETdata %>% group_by(Participant,trial,bin) %>% filter(row_number()==1)
#  - from wide to long (see http://www.cookbook-r.com/Manipulating_data/Converting_data_between_wide_and_long_format/)
ETdata_toplot <- gather(ETdata_toplot, focus, gaze, top_female:bottom_male)

# Plot the results
ggplot(ETdata_toplot, aes(x=bin,y=gaze,color=focus)) +
  geom_line(stat="summary",fun.y="mean") +
  facet_grid(Selection~.)